
What are correlations in geospatial datasets?
The true power of geospatial data can be unlocked when reliable links are made between datasets. Think of navigation apps that notify you of delays on your route nearly as they happen, and recalculate your journey to get you to your destination as quickly as possible. This is an example of two or more datasets working in concert to produce something of value to the user.
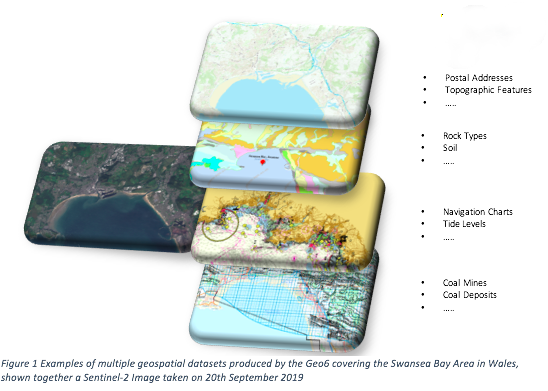
Therefore, its standard practice for geospatial analysts to relate features from multiple datasets (e.g. See Figure 1) via common identifiers e.g. geographic coordinates and addresses.
In many cases, creating such a relationship between datasets is straightforward because the features of interest are identical in different datasets. For instance, a record (e.g. an address) of a property would exist in electricity and water company datasets. To create a new data layer containing both electricity and water supply information would involve relating the layers using the house address. This type of relationship between features is referred to as 'same-as' relationship.
However, the situation becomes complicated when a relationship is required between features that although share common identifiers e.g. geometries and attributes, they represent different types of features. In this instance, only a ‘correlation relationship’ would provide a robust link between the two datasets. See Figure 2 for a schematic illustration of the correlation relationship.
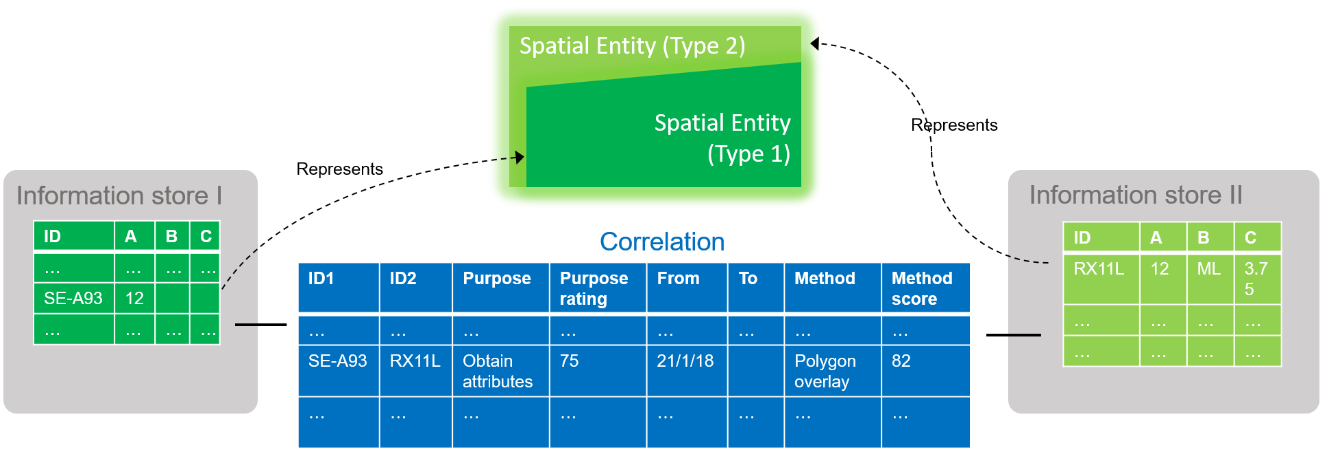
Figure 2: Correlations between different (but similar) entities.
Eliminate ambiguities and unlock the potential
Due to the complex and specialised nature of information involved, building these correlations is non-trivial, takes a rather long time, and often the results are discarded after the activity. This project believes that correlation lookup tables produced by the subject matter experts between key geospatial datasets will help to eliminate the ambiguities and unlock the potential of implicit information for many applications. To be precise, the project has three core aims:
- develop a formal data structure to model the correlation between features;
- develop a working demonstrator to show the population of the data structure; and
- propose governance and maintenance approaches for correlation service.
The project has been structured into 6 work streams. In a classic AGILE style, the project started in Autumn 2019 with the work stream on creation of user personas and user journey maps. This approach proved very useful as it revealed previously unknown examples of efforts to make correlation relationships, especially in the geospatial industry. Subsequent work streams have developed a candidate data model and interface prototypes, which would respectively allow the storage and distribution of the correlation relationships. The remaining work streams have been focussed on developing proposals for governance of the sharing of correlations, and potentially an enduring service that will support the production and publication of correlations.
What's next?
We have created a new LinkedIn Group, the Geospatial Commission - Improving National Data Group. to offer the opportunity to build open discussions around geospatial data improvement. Come and join our first conversation on the Data Model we have developed to share correlations, we would love to hear your thoughts and share insights.
And if you have an interesting example of correlations, relating to geospatial data, that you would like us to know about, and test whether the data structure can represent it? Do get in touch with us at geospatialcommission@cabinetoffice.gov.uk
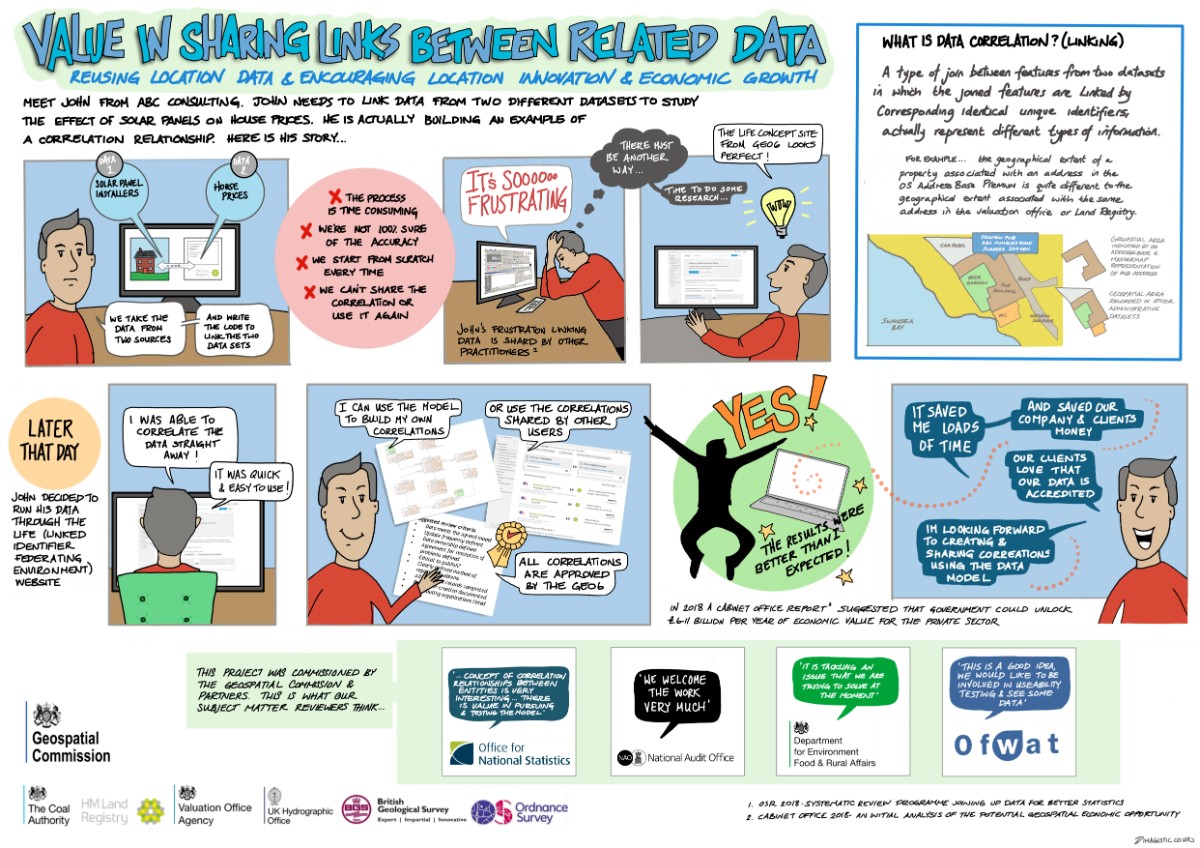
Image Sources:
- British Geological Survey, http://mapapps.bgs.ac.uk/geologyofbritain/home.html
- Coal Authority Interactive Data Viewer, https://mapapps2.bgs.ac.uk/coalauthority/home.html
- Ordnance Survey Zoom Stack, 2019
- Copernicus Sentinel-2 2019 image
- UKHO, © British Crown Copyright 2019. All rights reserved. NOT TO BE USED FOR NAVIGATION