The Public Sector Geospatial Agreement (PSGA) continues to ensure the provision and improvement of essential location data for the public sector and beyond. One element of the agreement supporting improvements is a Research and Development Programme. Stefano Cavazzi, Principal Innovation & Research Scientist and Nikos Patias, Junior Policy Analyst and PhD student, outline how location data can help us trace our history and inform the future, supporting local decision-making to build better neighbourhoods.
The neighbourhood is the geographic scale at which we all interact with local places and services regularly. Each of us has a somewhat different sense of place and a unique mental map of our own neighbourhood. However, neighbourhoods are ever-changing with demographic and socioeconomic shifts occurring across Great Britain (GB). These shifts contribute to the altering structure and spatial distribution of neighbourhoods, including changes in the demand and provision of housing, infrastructure and social services.
As part of the PSGA research and development programme, Ordnance Survey (OS) funded a PhD studentship at the Data Analytics and Society Centre for Doctoral Training at the University of Liverpool, to develop an analytical framework to help understand changes in local neighbourhoods over time. This framework was used to identify neighbourhoods in GB’s largest cities that have increased their urban sustainability - green spaces, cycle lanes, solar-powered buildings, etc. - over the past 15 years, and to assess the socio-economic trajectory of different neighbourhoods across GB.
Sustainable urban development of major British cities
The research focussed on the 12 largest cities in Great Britain (Birmingham, Bristol, Edinburgh, Glasgow, Leeds, Liverpool, London, Manchester, Newcastle upon Tyne, Nottingham, Sheffield and Southampton) as according to the latest census at the time (2011) these covered a little more than 80% of the country’s population. A 1km2 grid (OS British National Grid) was used to approximate the size of a neighbourhood - the area an average person could cover to access essential services and amenities within 15 minutes on foot.
Two types of geospatial data were identified to provide the information required to characterise neighbourhoods:
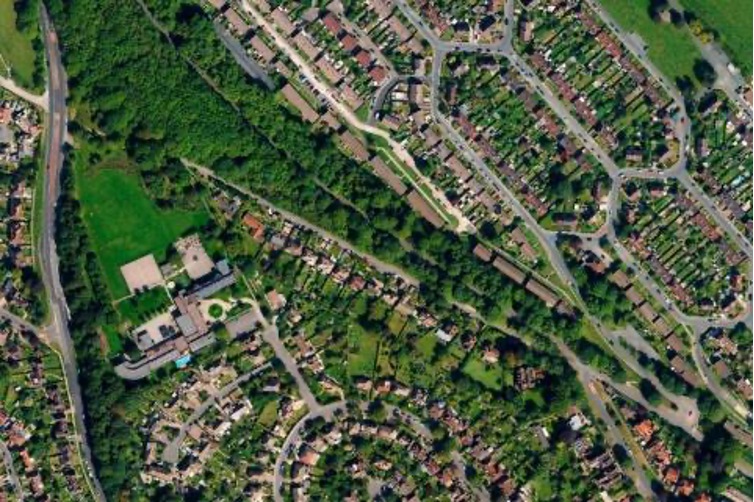
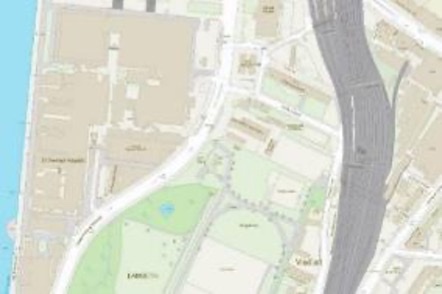
- detailed topographic data of the physical environment, including buildings, roads, paths, water and other land features (OS MasterMap Topography Layer)
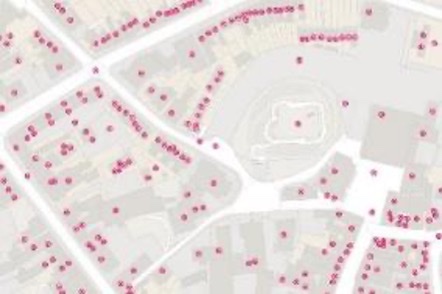
- data about properties, like the classification between residential and commercial addresses (OS AddressBase and OS Address Point before 2011)
Three indicators of urban structure were created capturing:
- compactness (the degree of mixing between residential and commercial land use)
- green space availability
- walkability (available footpaths and pavements)
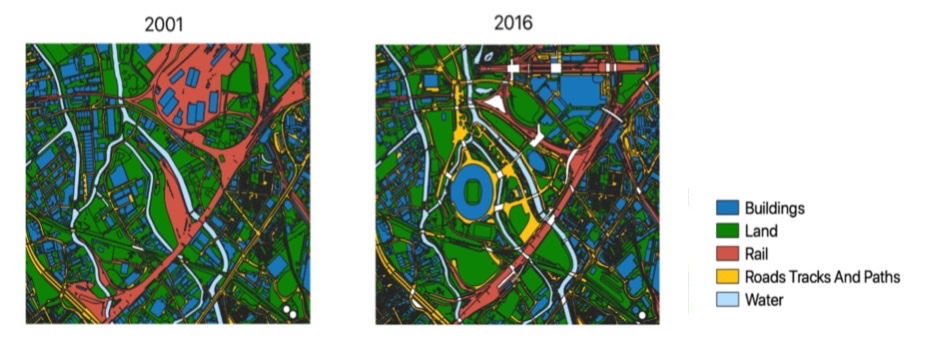
These were then combined to create an overall Sustainable Urban Development Index of neighbourhoods. The analysis covered four temporal map snapshots covering 15 years (2001-2016). The findings showed that several areas across the country have significantly increased their urban sustainability. The cities with the highest proportion of improving neighbourhoods were Edinburgh, London and Newcastle, while Leeds, Southampton and Birmingham had the least.
The primary urban interventions affecting these changes differed among cities. Edinburgh benefited from increased green space availability, London from compactness and Newcastle from walkability interventions. Leeds suffered from a decrease in walkability, and Southampton and Birmingham from a similar reduction in compactness and green space availability.
These variations across cities reflect differences in the scale and timing of urban regeneration across GB during the first part of the 21st century. This project’s approach can help to identify imbalances in the built environment, not only between different regions across the country but also within cities which might be missed by more traditional city-level indicators. It can also generate empirical evidence and unveil how past urban planning interventions shaped the local built environment informing future planning strategies.
Socioeconomic trajectories of neighbourhoods
Our second analysis incorporated census data from the Office for National Statistics (ONS) to identify common trajectories of change, characterising how the demographic and socioeconomic structure of each neighbourhood had transformed over time. The neighbourhood trajectories in GB (1971-2011) dataset is available at the Consumer Data Research Centre with an Open Government Licence (OGL).
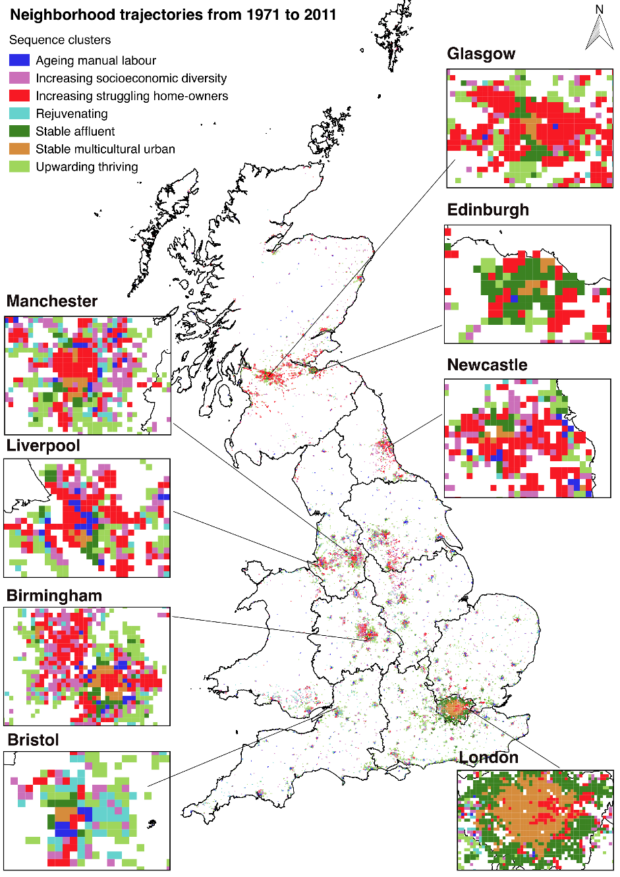
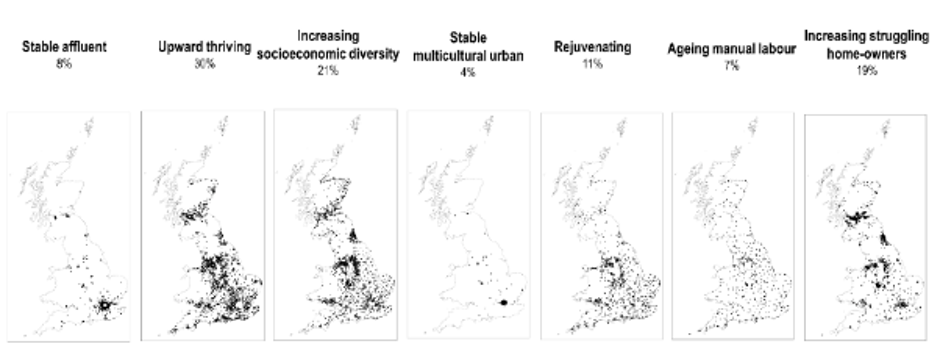
The results reveal seven prevalent trajectories of neighbourhood change across GB, identifying neighbourhoods which have experienced patterns of socioeconomic progress, stability or decline. These are the following:
- Stable affluent - areas remaining persistently affluent
- Upward thriving - areas transitioning from an older striving type to a thriving suburban type, or remaining a thriving suburban type
- Increasing socioeconomic diversity - areas transitioning from a struggling or blue-collar families type to a mixed worker’s suburban type
- Stable multicultural urban - areas remaining multicultural in urban locations
- Rejuvenating - areas transitioning from an older striving type to a mixed worker’s suburban type
- Ageing manual labour - areas transitioning from being dominated by blue-collar families to an older striving neighbourhood type
- Increasing struggling homeowners - areas transitioning from a family in council rent type to a struggling type
The research findings have been highlighted in a policy brief that was published by the UK2070 Commission as an independent inquiry into city and regional inequalities in GB.
Key findings
This project addressed the current lack of a coherent methodology to analyse neighbourhood changes over space and time. It improved our understanding of spatial inequalities across the built environment and population in GB over the last decades.
The main findings were:
1) Demonstrating how historical archives of Ordnance Survey and ONS data can be used to assess change in the built environment over time and the geodemographic consequences on a population
2) Developing a framework to identify and measure changes in the built environment - at the neighbourhood scale - as well as quantifying the main underpinning urban factors responsible for this change (compactness, green space availability and walkability)
Monitoring change in the built environment at the neighbourhood scale, whether in cities, suburbs or small rural towns, can provide the evidence needed to help communities to reshape the delivery of public services to meet local needs. Neighbourhoods can also be the right level to tackle issues, like the future of mobility, an ageing society, sustainability and economic transition, that appear unmanageable at the national scale.
A final word from Jeremy Morley, Chief Geospatial Scientist at Ordnance Survey:
“At Ordnance Survey we have a very active research programme dedicated to exploring the new uses to which our data will be put. We are always looking for better ways to use geospatial information for the public good.”
The Geospatial Commission is keen to reflect and make available a wide range of views and approaches, including those that may stimulate debate. The Geospatial Commission does not necessarily endorse the content provided by guest contributors.
Sign up to get an email notification every time we publish a new blog post. For more information about this and other news see our website, or follow us on Twitter and LinkedIn.